TCF Whiteboard help
Overview
Whiteboard is a tool that allows AWC, NAMs, CWSUs, and airline partners to collaborate on the TFM Convective Forecast (TCF). The whiteboard collaboration consists of two parts: a chatroom for text discussion and a visual forecast tool on AviationWeather.gov. The chatroom utilizes the National Weather Service enterprise chat software, NWS Chat 2.0 (Slack). Users must be added to the private TCF collaboration chat channel. Collborators use AviationWeather.gov editable maps to for creating a visual collaborative forecast, similar to the previous drawing collaboration process, to contribute to the office forecast issued by the Aviation Weather Center.
Click here to watch a tutorial video on the TCF Whiteboard.
Tutorial
During the collaboration windows, the Whiteboard loads the current TCF prelim product, produced by an AWC forecaster in light blue, displayed within the Graphical Forecasts for Aviation framework. The time slider along the bottom has tick marks for each of the forecast hours and the buttons along the right side of the screen adjust settings on the map. The legend can be toggled on using the icon at the bottom right of the screen. Map layer such as FIR boundaries and navigational aid can be added to the map.
Collaboration users are able to draw and save polygons and lines as suggested forecast depictions for consideration in the Collaborative Decision Making (CDM) process using the Drawing Tools on the left side of the map. Each contributor is assigned a color that is used for drawn objects shown to all collaborators including AWC.
Layer Selector

The layer selector provides the opportunity to toggle layers on and off from the map. The default map displays the TCF prelim from an AWC forecaster, TCF collaboration from other NWS partners, and any additions the user has made to the map. Add radar imagery or echo tops by checking the top box and selecting the product.
Map Options
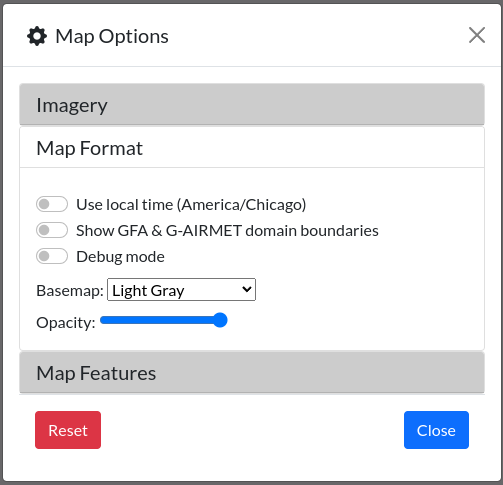
Click the gear icon below the Layer selector at the top right corner to configure the map options. A pop-up window will appear in the middle of the screen providing access to additional settings. The radar settings can be adjusted under the Imagery dropdown. Map Format provides options to adjust the map background and clock. Map features provides a list of navigation and geological overlays to the map. To close the map options, click the close button or anywhere outside of the pop-up window.
User tools
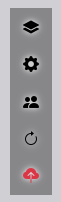
Users
Click the people icon to view other collaborators viewing the whiteboard at the same time. If another collaborator has provided a visual forecast suggestion, the color on the map will be associated with the name of the user who drew the polygon.
Refresh
The Whiteboard automatically refreshes every 20 seconds, however users can refresh immediately using the reload button. This can be used especially in tandem with a user providing feedback in the NWS Chat 2.0 text discussion of relevant updates to the shared map.
Save
Save the polygon that has been drawn using the red save icon. The icon will only appear red when there is new information that has not yet been saved. When the user changes the valid forecast time using the timeslider along the bottom of the map, the polygon will automatically save so no work is lost.
Drawing tools
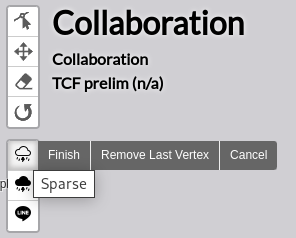
Draw a new polygon or line by using the cloud icons along the left side of the map. The two different clouds represent sparse and medium coverage, however this information can also be changed after the face. The third draws solid lines. Once drawn clicking a polygon pops up the attributes of confidence, coverage, and echo tops. The other icons allow the user to edit vertices, move, erase, or rotate the polygon or line that was drawn.
Collaboration Times
Collaboration times are relative to local time for consistency with Collaborative Decision Making (CDM) planning cycles. UTC forecast cycle and collaboration times therefore may be different with Daylight Saving Time. Times below are relative to the current calendar day.
| Forecast Cycle | UTC Time | Local Time |
|---|
FAQ
What has changed recently?
The entire site was overhauled in October 2023. For information about the most recent updates, please see the change log.
How often do you update the website?
We fix critical bugs as soon as possible, and we deploy functional upgrades regularly. Please let us know if you find something that isn’t working.
Why is my URL link not working?
As part of the upgrade to the site, some pages were consolidated and some URL's have changed. Check out the link conversions to find what you are looking for. If you are still unable to find the information you are looking for, submit a question using the envelope in the top right.
Why can't I log in to my account?
Most features of AviationWeather.gov do not require an account. If you recently signed up for a new account, please check your email (including spam folders) for a confirmation email. Accounts are generally approved within one or two business days.
Where is the METAR page?
The interactive Graphical Forecasts for Aviation observation tab displays METARs along with other current data including surface fronts and radar imagery. To view METARs alone, click on the Layers button at the top right corner of the map and deselect items you do not wish to view. Decoded METARs can be displayed by enabling the "decoded METARs" option in the Map Options under the gear icon on GFA.
Raw and decoded textual METAR data can be displayed by selecting the Products dropdown and selecting METAR data.
Where is the Satellite/Radar page?
Satellite and radar imagery are available on the observations tab of the interactive Graphical Forecasts for Aviation, that displays surface observations, imagery, fronts, and more in one place. Satellite imagery is an optional layer available from the layer selector in the upper right corner of the map. To display satellite or radar imagery alone, deselect items on the layer selector to simplify the display.
How can I submit PIREPs?
Sign up for an account on our registration page, select PIREP Submit Access, and be sure to include your airmen’s certificate number or affiliation with an airline, flight school, government or military organization for validation purposes to streamline the process. Accounts are validated via the FAA Airmen Inquiry.
Then watch your email in order to verify your address and then confirming your account. Once you have an account and are logged in, select "Submit a PIREP" from the Tools dropdown and fill out the form. For more information on PIREP submit, use the link at the bottom, or click here.
How do I access the Flight Path Tool?
The flight path tool is now embedded into the interactive Graphical Forecasts for Aviation map. Click on the route button along the right side of the map to open the display. Enter the airports to navigate, and select the product you wish to display from the dropdown. Watch a video on how to use the cross sections here.
Where is the HEMS (Helicopter Emergency Medical Services) tool?
The HEMS tool has been integrated into the interactive Graphical Forecasts for Aviation. Click on the helicopter button in the upper right part of the map to switch GFA from general aviation mode into low-altitude mode, which offers similar features as the HEMS tool.
What happened to ADDS?
The ADDS static graphics were phased out and replaced with the Graphical Forecasts for Aviation, which offers greater flexibility and configurability; some static graphics continue to be available for decision support. The ADDS Text Data Server has been succeeded by the Data API. Please let us know if you need assistance with the migration.
How can I display list of METARs and/of TAFs? What about decoded products?
The METAR and TAF data pages provide access to raw, tabular, and decoded output that automatically refreshes every five minutes. The page is designed for quick lookups and printability.
Where is the Text Data Server? How do I download METARs?
The Text Data Server was discontinued and has been replaced by the Data API. The new data offerings are more flexible and provide more data. Interfaces designed for greater compatibility with the Data Server to ease the transition as well as cache files to retrieve many reports at once are also available.
How do I access data for previous dates?
The METAR data page displays up to the previous 96 hours of observations. The Archive View allows viewing nearly all products on the site as they were presented for up to the past two weeks. For data more than 14 days old please reference the resources available on bottom of the Archive View page.
Data appears to be missing. Where can I find more information?
Automated status information and the latest announcements can be found on the status page
Why is a particular station not reporting?
The site generally displays all observations within a minute or two of being reported as we receive it. Individual station outages are usual indicative of a problem at the source. AWC does not maintain weather stations or observing platforms.
What do all of the map symbols indicate?
A full listing of map symbols is available.
Why is the map dark?
Dark mode is automatically applied based on systems settings. Selecting the person icon in the upper right and toggling the switch to the left disables this mode.